


Navigation Analytics: The Most Underutilized Data in E-Commerce
Most e-commerce operators monitor the standard performance metrics closely: traffic, conversion rate, average order value, revenue by channel. Fewer look at navigation-specific analytics — click-through rates on individual navigation elements, session paths that pass through navigation, drop-off rates after navigation interactions. This data exists in standard analytics platforms and is directly actionable, but it's rarely part of regular reporting.
The reason navigation analytics are underutilized is partly structural — it requires more setup than standard funnel reporting — and partly because the implications of navigation data are less intuitive than product or campaign data. When a product's conversion rate drops, the action is clear: investigate the product page. When a navigation element's click-through rate drops, the action is less obvious: is the label wrong? Is the placement wrong? Has something else drawn attention away from it?
Despite this complexity, navigation analytics reliably reveal expensive problems that are invisible in aggregate metrics. A store with a stable overall conversion rate might have one category with a 0.5% navigation click-through rate (a sign the label isn't working) and another with a high click-through rate but low add-to-cart rate (a sign visitors arrive at that category expecting something different from what they find). Both are expensive problems. Neither shows up in standard conversion funnel reports.
"We'd been trying to fix our conversion rate by testing different product page layouts for six months. When we finally looked at our navigation click-through data, we found that 40% of our mobile visitors were opening the hamburger menu, clicking nothing, and leaving. The menu structure was confusing — too many similar-sounding categories. One label change and a Tab Bar addition later, our mobile conversion rate improved more in two weeks than all the product page testing had achieved in six months."
— A Navi+ customer, home goods brand
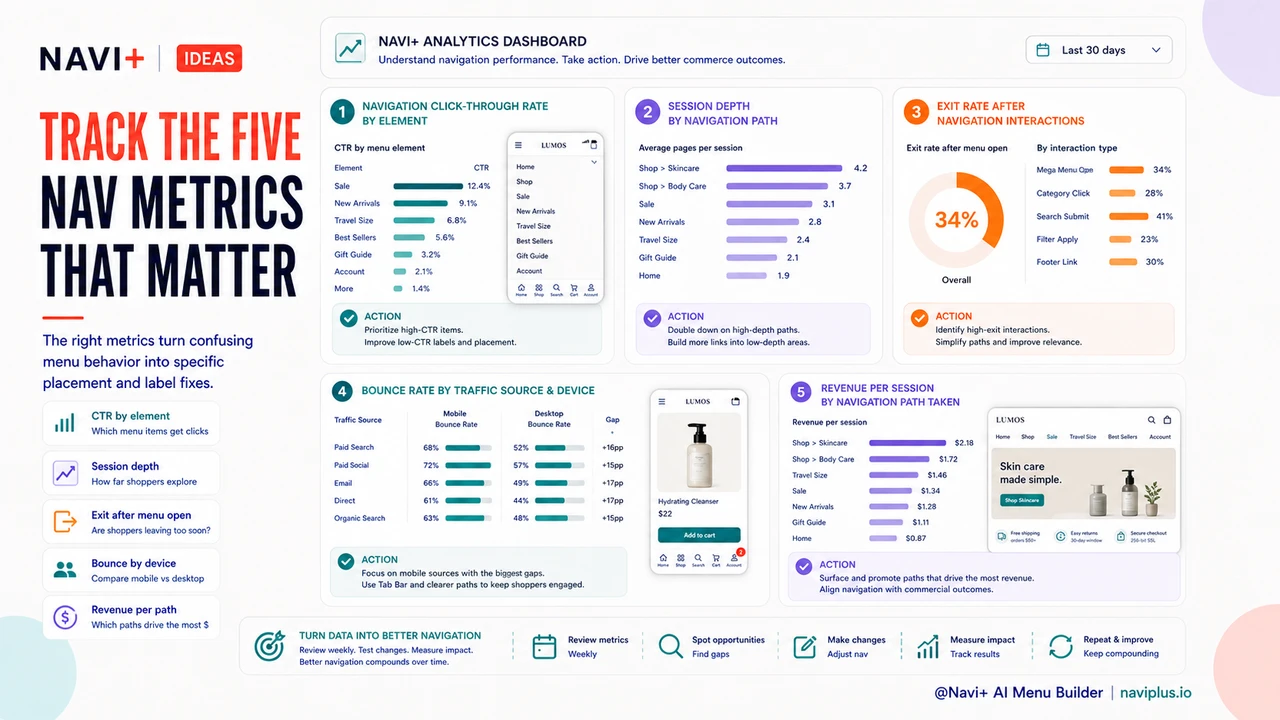
The Five Navigation Metrics That Matter
1. Navigation click-through rate by element. What percentage of page views include a click on each navigation element? Low rates on specific elements indicate either low relevance or poor placement. High rates indicate high-value destinations — these should be given priority placement in the navigation hierarchy.
2. Session depth by navigation path. Sessions that include navigation interactions — particularly multiple navigation clicks — correlate strongly with higher purchase rates. Measuring session depth segmented by whether any navigation was used reveals the value of navigation engagement and the cost of navigation avoidance.
3. Exit rate after navigation interactions. When a visitor opens the navigation menu and then exits without clicking anything, it signals that navigation failed them — they were looking for something they didn't find. Exit rate after menu open is a direct measure of navigation confusion or gap.
4. Bounce rate by traffic source, segmented by device. Bounce rate differences between mobile and desktop, or between organic and paid traffic, often trace to navigation. Mobile visitors bounce more from stores with desktop-first navigation. Paid visitors bounce more when the navigation doesn't reflect the campaign they came from.
5. Revenue per session by navigation path taken. Not all navigation paths are equal in revenue outcome. Identifying which navigation sequences — which category combinations visited in a session — correlate most strongly with purchase reveals which navigation destinations are most commercially valuable. These high-value destinations should be most prominent in the navigation architecture.
| Metric | What It Reveals | Action It Suggests |
|---|---|---|
| Low nav click-through on category | Label not resonating or poor placement | Rename or reposition the category |
| High menu open, high exit without click | Navigation structure confusing visitors | Simplify structure, clarify labels |
| High mobile bounce, low desktop bounce | Navigation not mobile-optimized | Add Tab Bar (Navi+) |
| High category click, low add-to-cart | Category label mismatches products inside | Realign label or curate collection |
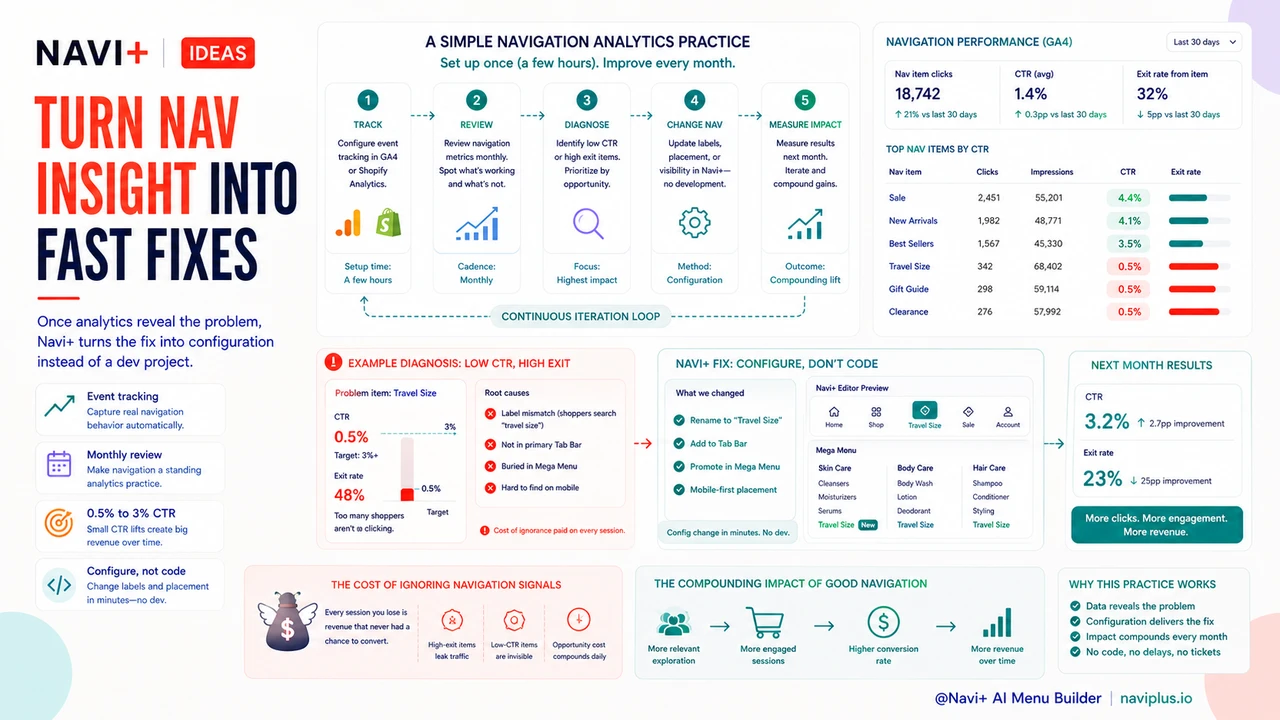
Building a Navigation Analytics Practice
Starting a navigation analytics practice doesn't require sophisticated tooling — Google Analytics 4 or Shopify Analytics, configured to track navigation link clicks as events, provides the data needed for the metrics above. The investment is setup time (typically a few hours to configure event tracking correctly) and the habit of reviewing navigation metrics monthly alongside standard performance metrics.
The ROI on this practice is high because navigation problems compound silently. A navigation element with a 0.5% click-through rate instead of a 3% rate has been underperforming on potentially millions of page views. Once identified and fixed, that improvement persists on every future page view. The cost of ignorance in navigation analytics is paid on every session the store receives while the problem goes undetected.
Navi+ makes navigation changes fast to implement — once analytics reveal a problem, the fix is a configuration change, not a development project. The combination of analytics visibility and implementation speed turns navigation improvement from a slow, costly process into a rapid iteration cycle.
Try it free — no code, no developer needed
Install in minutes on Shopify, WordPress, or any website.