


Where Conversions Are Actually Lost
Conversion rate optimization for e-commerce is dominated by discussions of checkout flow, product page copy, hero image selection, and email capture pop-ups. These optimizations are worthwhile — but they operate on the fraction of visitors who have already navigated deep enough into the store to reach a product page or checkout. For most stores, the largest conversion losses happen earlier: in the navigation layer, before visitors ever reach the pages being optimized.
Consider the funnel arithmetic. If a store has a 2% overall conversion rate with 10,000 monthly visitors, it's generating 200 transactions. If navigation improvements increase the proportion of visitors who reach a product page (rather than bouncing from landing pages because they can't navigate) by 20%, the addressable base for product page and checkout optimizations grows from, say, 4,000 product page visitors to 4,800. Even with no change to product page or checkout conversion rates, that 20% navigation improvement translates directly to more transactions.
The lesson is not that product page and checkout optimization are unimportant — it's that navigation optimization expands the audience available for all downstream optimizations. Improving conversion at the navigation stage compounds through every subsequent stage of the funnel.
"We'd spent six months optimizing our product pages — better photos, more detailed descriptions, social proof widgets, urgency signals. Overall conversion barely moved. Then we added a Tab Bar and reorganized the Mega Menu based on what analytics showed visitors were actually trying to find. In the next 60 days, overall conversion went up 0.6 percentage points — more than all the product page work combined. The product page improvements weren't wrong; we'd just been optimizing pages that most of our visitors weren't reaching."
— A Navi+ customer, apparel brand founder
Diagnosing Navigation's Role in Conversion Loss
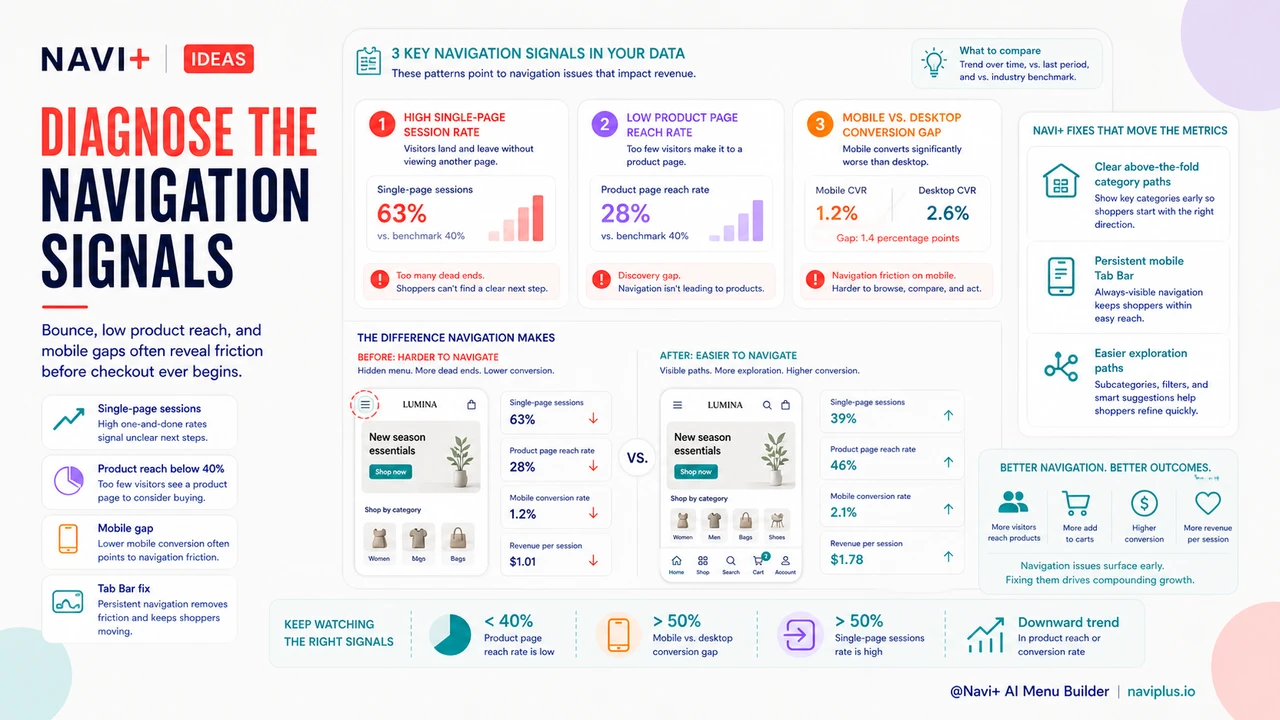
Three analytics signals indicate that navigation is a meaningful contributor to conversion loss:
High single-page session rate. Sessions where a visitor views only one page and leaves (commonly measured as "bounce rate" for pageview-based analytics, or "engagement rate" in GA4) are often navigation failures. When the landing page doesn't provide a clear navigation path forward, or when the navigation visible above the fold doesn't match the visitor's intent, they leave without exploring. Navigation improvements that make exploration easy reduce single-page session rates.
Low product page reach rate. Divide total product page views by total sessions to get the proportion of sessions that reach at least one product page. If this ratio is low — fewer than 40% of sessions reaching a product page — a significant number of visitors are leaving before they've had a chance to evaluate any product. Navigation is almost always a contributing factor in low product reach rates.
Mobile vs. desktop conversion gap. Most stores show a significant mobile-desktop conversion gap. While some gap is attributable to device-context differences (people browse on phones but purchase on computers), a substantial portion of most stores' mobile conversion deficit traces to mobile navigation being harder to use than desktop navigation. The hamburger menu that works acceptably on desktop is a meaningful friction source on mobile — the Tab Bar eliminates this friction for the majority of a store's sessions.
The Navigation Investment Calculation
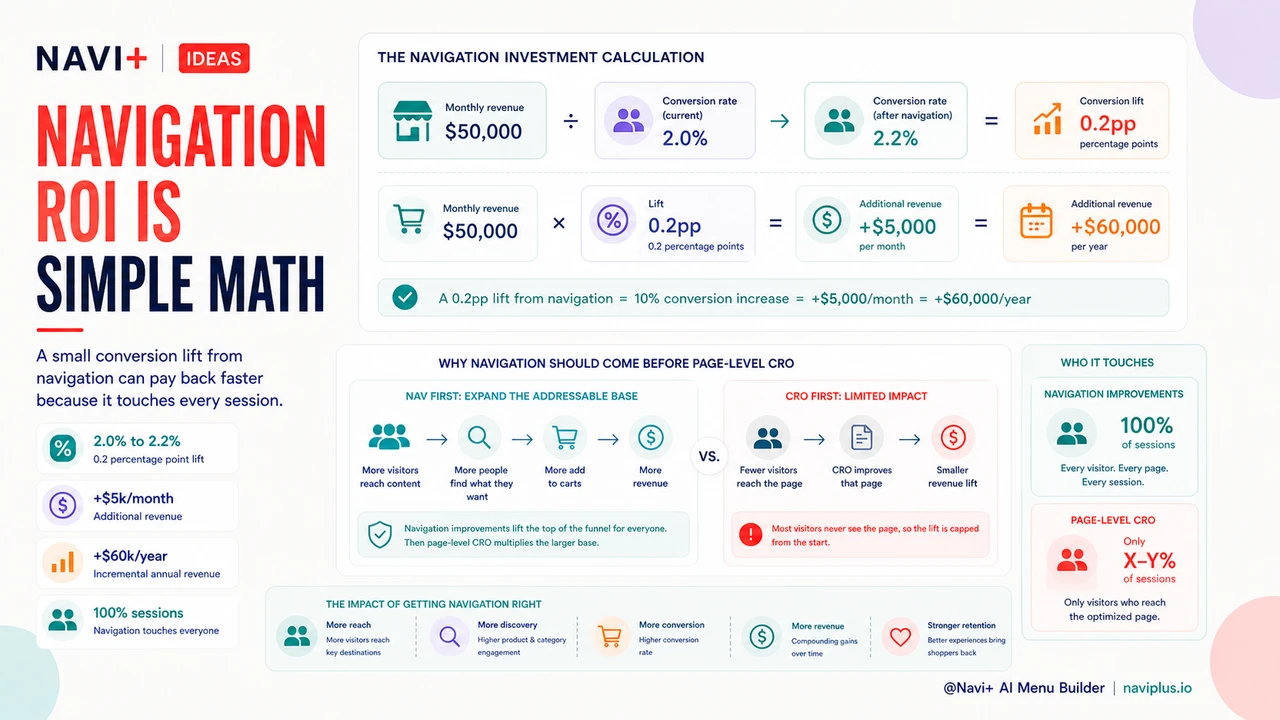
The financial argument for navigation investment is more straightforward than for most CRO categories. Consider a store with $50,000/month in revenue and a 2% conversion rate. A 0.2 percentage point navigation improvement — from 2.0% to 2.2% — represents a 10% conversion increase, or $5,000/month in additional revenue. At the annual level, that's $60,000 in additional revenue attributable to the navigation improvement.
The cost of the navigation improvement — a Navi+ subscription — is a fraction of the first month's revenue gain. This is a more favorable ROI than virtually any other CRO category (custom landing page builds, product photography retakes, checkout flow redesigns) because navigation touches 100% of sessions rather than a portion of them.
| CRO Investment Type | Sessions Affected | Typical Lift |
|---|---|---|
| Checkout flow optimization | Sessions that reach checkout (~5–15%) | 0.1–0.3% overall CVR |
| Product page optimization | Sessions reaching product pages (~30–60%) | 0.1–0.5% overall CVR |
| Navigation improvement (Navi+) | All sessions (100%) | 0.2–1.0% overall CVR — broader reach multiplies impact |
Starting with Navigation Before Other CRO
The optimization sequence matters. Navigation improvement should precede page-level CRO because it determines how many visitors reach the pages being optimized. A conversion improvement on the product page has a different total impact when 50% of sessions reach product pages versus 35% — the same page-level lift generates 43% more revenue on the larger addressable base. Navigation investment first expands the base; page optimization then improves performance on a larger audience. This sequence consistently outperforms the reverse.
Try it free — no code, no developer needed
Install in minutes on Shopify, WordPress, or any website.